
We Are Developers World Congress Day 2
WeAreDevelopers World Congress is considered by many as the world’s flagship event for developers. Over three days highlighting latest advancements in Web I discovered tools that helps increasing customer experiences around the globe.
Part of the conference were advertising AI solutions such GitHub Copilot. Showcasing informative tutorials brings excitement for many developers, but the gray areas and lack of the quality and sources of information brings more questions about legislation and the trusted authorship, which gives credit and implies accountability for published work.
https://www.youtube.com/embed/wDMWEAjncjU?start=5528&feature=oembed


WebAR projects with 8th Wall
Web-based augmented reality enables augmented reality (AR) to work within a browser. Web AR opens up new ways to connect with users by engaging them in extraordinary, interactive experiences anywhere they are and with no app required.
OS support
Unlike the ARKit and ARCore the 8th Wall Engine powers AR that works in the browser across all devices. It has been built entirely with using JavaScript and WebGL according to Web compliance standards.
Impact on customers
Consumers spent on average over 5 minutes interacting with the WebAR experiences.
The e-commerce experiences that combines both physical and unique digital experiences increase customer satisfaction and boost their confidence in their purchase decisions.
Projects
Bloomingdales sent over 400,000 AR-enabled catalogs to create an immersive, shoppable, and shareable experiences. In this campaign they combined both physical and AR Web frameworks to supplement customer experience.
https://player.vimeo.com/video/387865596?dnt=1&app_id=122963
Customers scanned a QR code inside the catalog to activate the WebAR experience. Next, they pointed their camera at an image target to automatically showcase exclusive looks in their own physical space. The holograms of models helped users see how the styles looked and moved in real-life.
Image and label mapping into the real environments are common for AR digital products. Here is another example of call for action template using CSS2D renderer to label items in 3D scene.
At a time when all festivals and shows were canceled, Burger King and UK rap artist, Tinie Tempah, teamed up to deliver the world’s tiniest concert via AR. To create this WebAR experience, XR studio worked with Dimension Studios to record Tinie performing his hit single using volumetric capture. The volumetric video was then exported and added on top of a 3D rendering of a Burger King Whopper. It allowed a hologram of Tinie to perform his latest hit ‘Whoppa’, with the iconic signature burger as his stage.
Video autoplay without user interaction- player that starts videos autoplay in a loop from photos and hides when it loses the focus.
Low code development platforms
Low-code is an approach to software development that requires little to no coding to build applications and processes. A low-code application platform (LCAP) uses easy-to-use visual tools to build user interfaces for adding business logic into an application.
Low-code platforms make software development 10 times faster than traditional methods when it comes to platform scalability. The traditional one-size-fits-all approach leaves organizations with many flaws in operations, such as developer team’s time wasted on software that is going to be limited use or increase the maintenance of a poorly built infrastructure.
By 2024, low-code application development will be responsible for more than 65% of application development activity.
Gartner, Inc. “Low-Code Development Technologies Evaluation Guide” February 26, 2019
According to the Core Web Vitals reports the the websites built with drag-and-drop website builders such as Wix which has built in React.js- are way more better performant than other React.js meta frameworks.
20% of all React.js websites are built with Wix, which is way more than any other React.js meta framework.
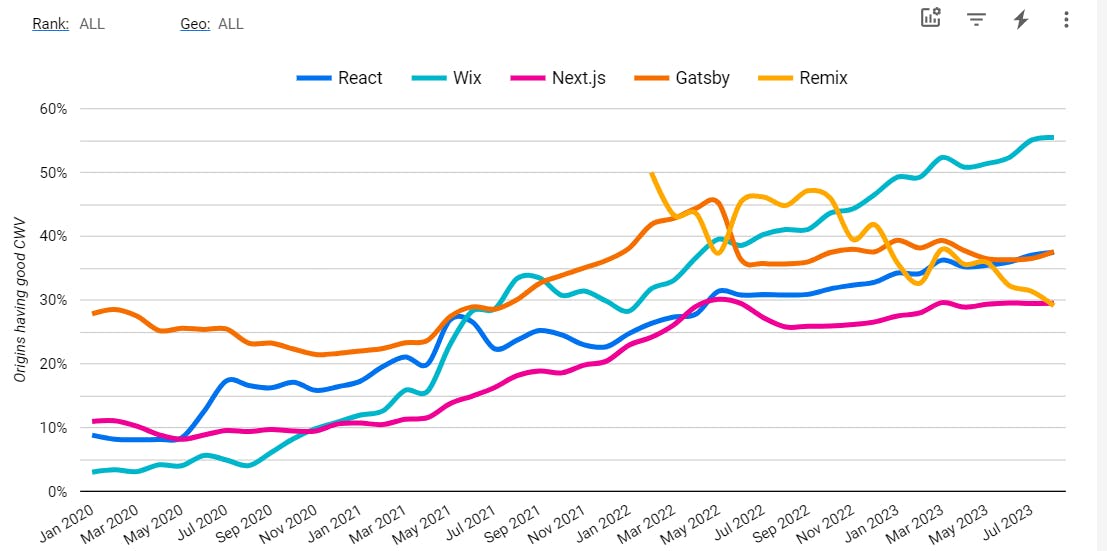
Based on the way performance for the Remix fluctuates indicates that there are only few websites using it- over 254 in March. Gatsby results are close to Remix, but there are many more- around 5000 websites using it.
Next.js is worth worse than React.js in general. Like other meta frameworks, next.js enables SSR which has been introduced to improve performance, and it has some other performance optimizations like Image rendering. Given that Next.js forms 8% of all React.js websites, this is very unfortunate.
Comparing JavaScript Frameworks Performance using Real-World data
The most impactful item in our arsenal is the framework that we use.
by Dan Shappir, Next Insurance
Introduction on what Web framework is and how to decide on which one will more performant on Web applications by Dan Shappir, JS Nation 2023 conference:
https://www.youtube.com/embed/wDMWEAjncjU?start=5528&feature=oembed
About CrUX
The Chrome User Experience Report (also known as the Chrome UX Report, or CrUX for short) is a dataset that collects data from browsers around the world and reflects how real-world Chrome users experience popular destinations on the web.
CrUX is the official dataset of the Web Vitals program. All user-centric Core Web Vitals metrics will be represented in the dataset.
The CrUX Dashboard is a Looker Studio (formerly Data Studio) dashboard that links to the raw origin-level CrUX data on BigQuery and then visualizes the data. It eliminates the need for users of the dashboard to write any queries or generate any charts. A page must be publicly discoverable to be considered for inclusion in the CrUX dataset.

The primary visualizations on these pages are the monthly distributions of experiences categorized as “Good”, “Needs Improvement”, and “Poor”. The color-coded legend below the chart indicates the range of experiences included in the category. For example, in the screenshot above, you can see the percent of “good” Largest Contentful Paint (LCP) experiences fluctuating slightly and getting slightly worse in recent months.
From Web2 to Web3 standards
The future is still so much bigger than the past.
Tim Berners-Lee

Now, to solve some of the problems of Web 2.0, there are new standards to give users control over their data.
About Solid
Solid is a specification that lets people store their data securely in decentralized data stores called Pods. Pods are like secure personal web servers for data. When data is stored in someone’s Pod, they control which people and applications can access it.

With Solid Protocol Single Sign In, and a common API any App can store data in any Pod from from a Pod Provider, or self-hosted. Solid applications store and access data in Pods using the Solid Protocol. Getting started as a Solid developer
Other resources
Forum https://forum.solidproject.org/
Github solid, solid-contrib, solidOS, inrupt, solid/chat
Interoperability
Within the interoperable Solid ecosystem, different applications can access the same data instead of requiring separate data silos specifically for the applications. For example, instead of inputting your email with your bank statement notification service, with your phone’s billing service, etc., you can instead store this information in your Pod and grant access to read your email information to these disparate services/applications.
For developer resources, see Developer Resources. For a listing of some Solid applications, see Solid Applications.
Access
What makes Solid special is the ability to store data in a way that promotes interoperability. Specifically, Solid supports storing Linked Data. Structuring data as Linked Data means that different applications can work with the same data.
In example, different pods might contain personal profile data, contact information, financial information, health, travel plans, or other information. The user could then join an authenticated social-networking application by giving it permission to access the appropriate information in a specific pod. The user retains complete ownership and control of data in the user’s pods.

Trust in data collaboration
With Solid’s Authentication and Authorization systems, it can be pre-determined which people and applications can access your data, and grant or revoke access to any slice of data as needed. Consequently the applications you decide to use can be granted access to a wider and more diverse set of information.
And just as you can share your data with others, they can also share their data with you. This creates rich and collaborative experiences across a combination of both personal and shared data.
Data Governance Act, an essential pillar of Europe’s data strategy
The Data Governance Act (DGA) provides a framework to encourage trust in voluntary data sharing to benefit businesses and citizens. The DGA is a cross-sector instrument that aims to open up government data more widely for reuse, encourage data sharing between companies and promote the use of data for altruistic purposes. A governance model within DGA is the provision of data mediation services. These services enable the sharing or joint use of data by companies.
There is a digital renaissance sweeping through Europe. It’s not the government that has the monopoly on data. Nor a few big companies. It is the people themselves who deserve ultimate control over their own data.
Raf Buyle, Lead Innovation athumi
Athumi company is one of the first to be ready to supply data mediation services as a neutral party. As a public company, they have a legal mandate to process personal and sensitive corporate data smartly and securely, while allowing those who share their data to retain full control and transparency, warranted by athumi’s governance.
Data spaces are the lever for Europe’s digital future
Companies that connects smoothly with European data spaces and the data economy are more powerful:
-
brings together relevant data infrastructures and governance frameworks to facilitate data pooling and sharing
-
implement data sharing tools and services for data pooling, processing and sharing by an open number of organisations
-
federate energy-efficient and reliable cloud capabilities and related services
-
include governance structures that are compatible with relevant EU legislation and define rights regarding data access and processing in a transparent and fair manner
-
improve data availability, quality and interoperability in domain-specific settings and across sectors
How to Monetize your APIs in Today’s Digital Economy?
APIs power more and more parts of web apps, mobile apps, and desktop apps today. An API, also called “Application Programming Interface”, allows an app to access functionality created by a third party through software.
With Rapid API Hub for Business you can customize your hub to match your brand and the unique requirements of your API program. Drive revenue by offering your APIs along with developer tools in a dedicated API hub that is complete with its own unique domain.
As companies begin to invest more heavily in APIs and look to take advantage of this new economy, the questions remain: How do companies actually drive revenue using APIs? What are the business drivers behind exposing APIs? What are the best practices for pricing? Are there industry standards for developing an API Monetization Strategy? Reference to webinar.
In conference Alex Walling explained how these pricing models include free, pay-per-use, affiliate networks, and indirect revenue models. After the introduction to API monetization, we will conduct a demo of the RapidAPI Hub platform and how it enables millions of developers globally to monetize their APIs.
Building software sustainably by measuring energy consumption
For the last decade, the Green Web Foundation has built open decision-making infrastructure to track and enable the transition to a fossil-free internet, including stewarding an open dataset to check if websites run on renewable energy, accessed over 2 billion times.
Foundation offers a free verification service for hosting providers who wish to become verified green hosting providers and get listed in Green Web Dataset and Green Web Directory.
Build carbon metrics into your own digital services
CO2.JS
CO2 cost that comes with every byte of data that’s uploaded, downloaded or stored. By being able to calculate these emissions, developers can be empowered to create more efficient, lower carbon apps, websites, and software.
CO2.js is an open-source JavaScript library that enables developers to estimate the emissions related to use of their apps, websites, and software.
In 2023, the Mozilla introduced carbon emissions estimates into its developer tooling. This case study explores how the Mozilla team and Green Web Foundation members made this possible using CO2.js.
This case study is already quite long, so rather than go through a step-by-step guide on how to use the profiler, we suggest you take a look at this blog post: Power measurements and CO2e estimates in Firefox Profiler.
IP to CO2 Intensity API
Combining data from website auditing tools such as WebPageTest with the IP to CO2 Intensity API can help you a more detailed sustainability profile of how the website is hosted. With knowledge of the origin IP address of a web page, you can determine what country that page was served from and get an average annual carbon intensity figure for that country’s energy grid. With this information, you might be able to start investigating other possible hosting locations. Reference to site.
This blog post auditing the COP27 homepage demonstrates how you might go about doing that.
Networks – Page weight & data transfer
Even though network energy use is pretty much a constant (I go into that here), it’s still important to be looking for ways reduce the amount of data we send to those visiting our sites.
When a page is loading, it might help to reduce energy consumption on the user’s device. And, if anything, it can help ensure that the people consuming our sites who may have data caps, or pay-as-you-go plans, don’t chew through their budgets faster than they expect.
“Good design is as little design as possible.”
Dieter Rams
Are video and animation used only when they add value to the user?
Although video is used less commonly in web design than imagery, when it is used it almost always constitutes the largest use of energy on the website. Plus, video or audio files that automatically play upon page load not only use up unnecessary bandwidth but can also undermine user experience.
Sustainable web design guidlines
Have user journeys been planned to help the user achieve their goals efficiently?
Shorter user journeys are not only appreciated by users, but they save energy by reducing the amount of time spent online and the number of pages loaded for users to accomplish their goals. This means providing exactly the amount of information needed to complete a task and nothing more (or less).
Design patterns that seek to lead the user on a longer journey must be avoided in order to serve our own goals, and should always prioritize users’ true intent.
Has the design used imagery efficiently?
Image files make up the majority of file size on most web interfaces, and so using images efficiently is one of the best strategies to reduce page weight and energy use. It also helps improve web performance.
Make sure images are scaled appropriately for display devices and responsively, and optimize file sizes. Size images as small as possible to achieve your objectives and see if you can achieve similar visual impact with alternatives such as SVG graphics and CSS styles. Also, consider the images themselves—detail and color contribute to image file size, so use simpler imagery, shallow depth of field and reduced color palettes.
Finally, “lazy load” images so they load as users scroll down the page instead of all at once up front. This will improve page performance.
Sustainable DevOps
Information related to a platform’s ecological impact should eventually be integrated to other tools such as SonarQube or GitOps, in order to have an overall view within a single interface.
GreenIT-Analysis is a browser extension that a practical tool for developers to analyse, evaluate and improve a webpage’s carbon footprint.
This extension can be incorporated into command-line interface (CLI), with Chromium browser in the background, controlled using Puppeteer, which opens each page to be analysed and emulates the extension’s operation. Reference to the practical solution.