Observability in cloud-native environments
Today at Observability Day and Cilium Con 2023, engineers that rely on healthy OSS ecosystem were sharing their insights about orchestration on cloud native environments with Cilium- cluster management with multi tenancy architecture and Elastic Network interface (Designing and Securing a Multi-Tenant Runtime Environment by Ahmed Bebars, New York Times), determining a threat model and risks- systematic (vs. ad hoc), large/small distribution, raw data (vs. derived data) risks,- network flow with automated egress and customer resource access and protection (Bloomberg), Network design that is vendor neutral, easy to scale-out, integrate with legacy systems and handles IPv4 exhaustion (Karsten Nielsen, IKEA Private Cloud and Networking).


Designing and Securing a Multi-Tenant Runtime Environment by Ahmed Bebars
Along with the other network design components- cross-host networking via underlying BGP routing daemon BIRD, distributed operations without a single point of failure scalable with Ceph block storage, declarative GitOps platform for Kubernetes with Argo CD.
Monitoring is not enough, Observability is required in heterogeneous computing environments. Anomaly detection- abnormal identification of unexpected events- using access logs can be trained from unsupervised to supervised learning that requires labels of the input time series that measures the accuracy of procedures compared with different algorithms. Anomaly detection can improve the observability in complex systems.
Observability tools for HTTP Network monitoring
Observability tools for HTTP Network monitoring is Prometheus, latest >2.40 version brings native histograms https://promcon.io/2022-munich/talks/promql-for-native-histograms/, efficient memory usage and performance, light on the past https://archive.fosdem.org/2020/schedule/event/histograms/.
OpenTelemetry protocol for translating data collections (receivers, processor, exporters) to observable backends, specification data points with data temporality, time observation in built sequence with timestamps that are important for subsequent points on initial rate- resets, gaps and overlaps. Data observation with histograms by using Open Telemetry’s Exponential Histograms in Prometheus, metrics aggregator API/SDK, bridge to internal telemetry from prometheus exporters, Elastic Common Schema (ECS), an open source specification formore standardized and structured format for vendor-generated logs.
Evolving and hybridizing signal types – journey from metrics/logs to traces to profiles
CNCF TAG Observability talk on “Evolving and hybridizing signal types – my journey from metrics/logs to traces to profiles” with Liz-Fong Jones: https://youtu.be/Ran6QogzxKA, meeting notes: https://github.com/cncf/tag-observability
“I cut my teeth trying to solve problems that we wouldn’t necessarily think of a systems engineering or systems administrative problems. Today Identifying abnormalities in logs are included in broader observability umbrella that are similarities in patterns caused by users, without necessarily having a knowledge of what are they trying to do. Rolling a circular buffer of logs as a signal that is desperately needed only when system is failing- what about problems that doesn’t appear a single point source of failure, or the problems we don’t know how to filter or group by.”
Infrastructure as Code (IaC) allows teams to define their infrastructure with code by utilizing a Software Development LifeCycle (SDLC) to the development phases and the familiarity of Git repositories, pull requests, testing, and peer development treating the infrastructure like any other software project.. HashiCorp open source tools for the infrastructure enables organizations worldwide to operate that infrastructure in the cloud.
Such an easy access to cloud environments require security measures taken place in any organization to design cloud architecture securely and prevent misconfigurations from being deployed.
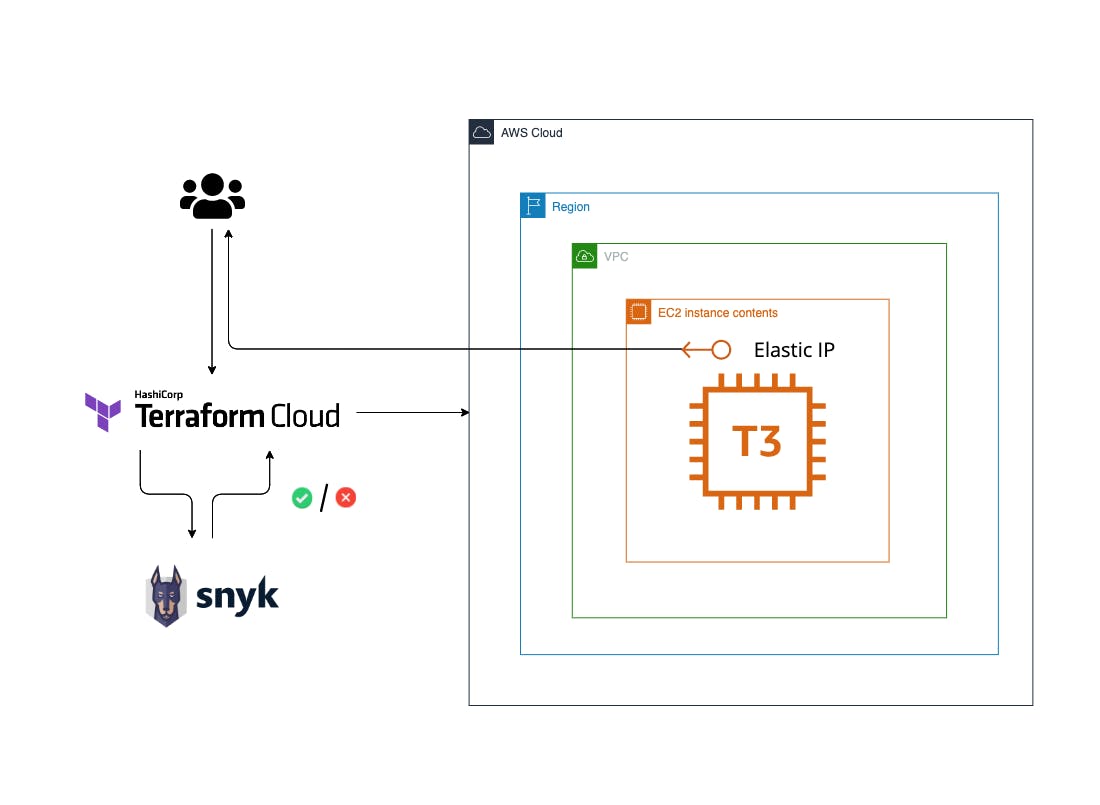
In Snyk & HashiCorp Workshop: Securing Your Infrastructure as Code
In Snyk & HashiCorp Workshop: Securing Your Infrastructure as Code we get the code and run some CLI operations with Snyk to find misconfigurations in your Infrastructure as Code definitions by cloning a respository with misconfigured Infrastructure as Code assets; run a Snyk CLI scan and observe results; exploit the vulnerability; fix issues locally and re-run scans; send results to the Snyk Website.
Snyk is one of the leading developer security platform that automatically integrates with a developer’s workflow and is purpose-built for security teams to collaborate with their development teams.
Snyk intro on their platform and integrating security tools with Terraform CLI, HashiCorp Terraform Cloud and Synk CLI is available online for a limited time: https://snyk-hashicorp.awsworkshop.io/.
In this workshop you will learn to:
-
setup AWS account
-
ensure you are following the remaining workshop steps as an IAM user with administrator access to the AWS account: Create a new IAM user to use for the workshop
-
setup AWS access keys to enable Terraform Cloud to deploy to your AWS instance
-
create an AWS workspace for your operations with help of cloud-based integrated development environment (IDE) via AWS Cloud9 console and assign an IAM Role to your Cloud9 instance for granting your EC2 instance permission to create resources.
-
Setup Terraform CLI and store the Terraform state of the infrastructures your pipeline will provision and deploy using Terraform
-
Setup the Snyk CLI to collect and send results about your vulnerabilities.
Other Snyk resources:
If you are new to Infrastructure as Code I recommend to start with Free Code Academy course about cloud infrastructure automation with Terraform declarative tool: https://youtu.be/SLB_c_ayRMo.
#O11yDay