
Maintaining an AZGS Broadband Seismometer, Arizona’s Broadband Seismic Network hosted by The AZGS
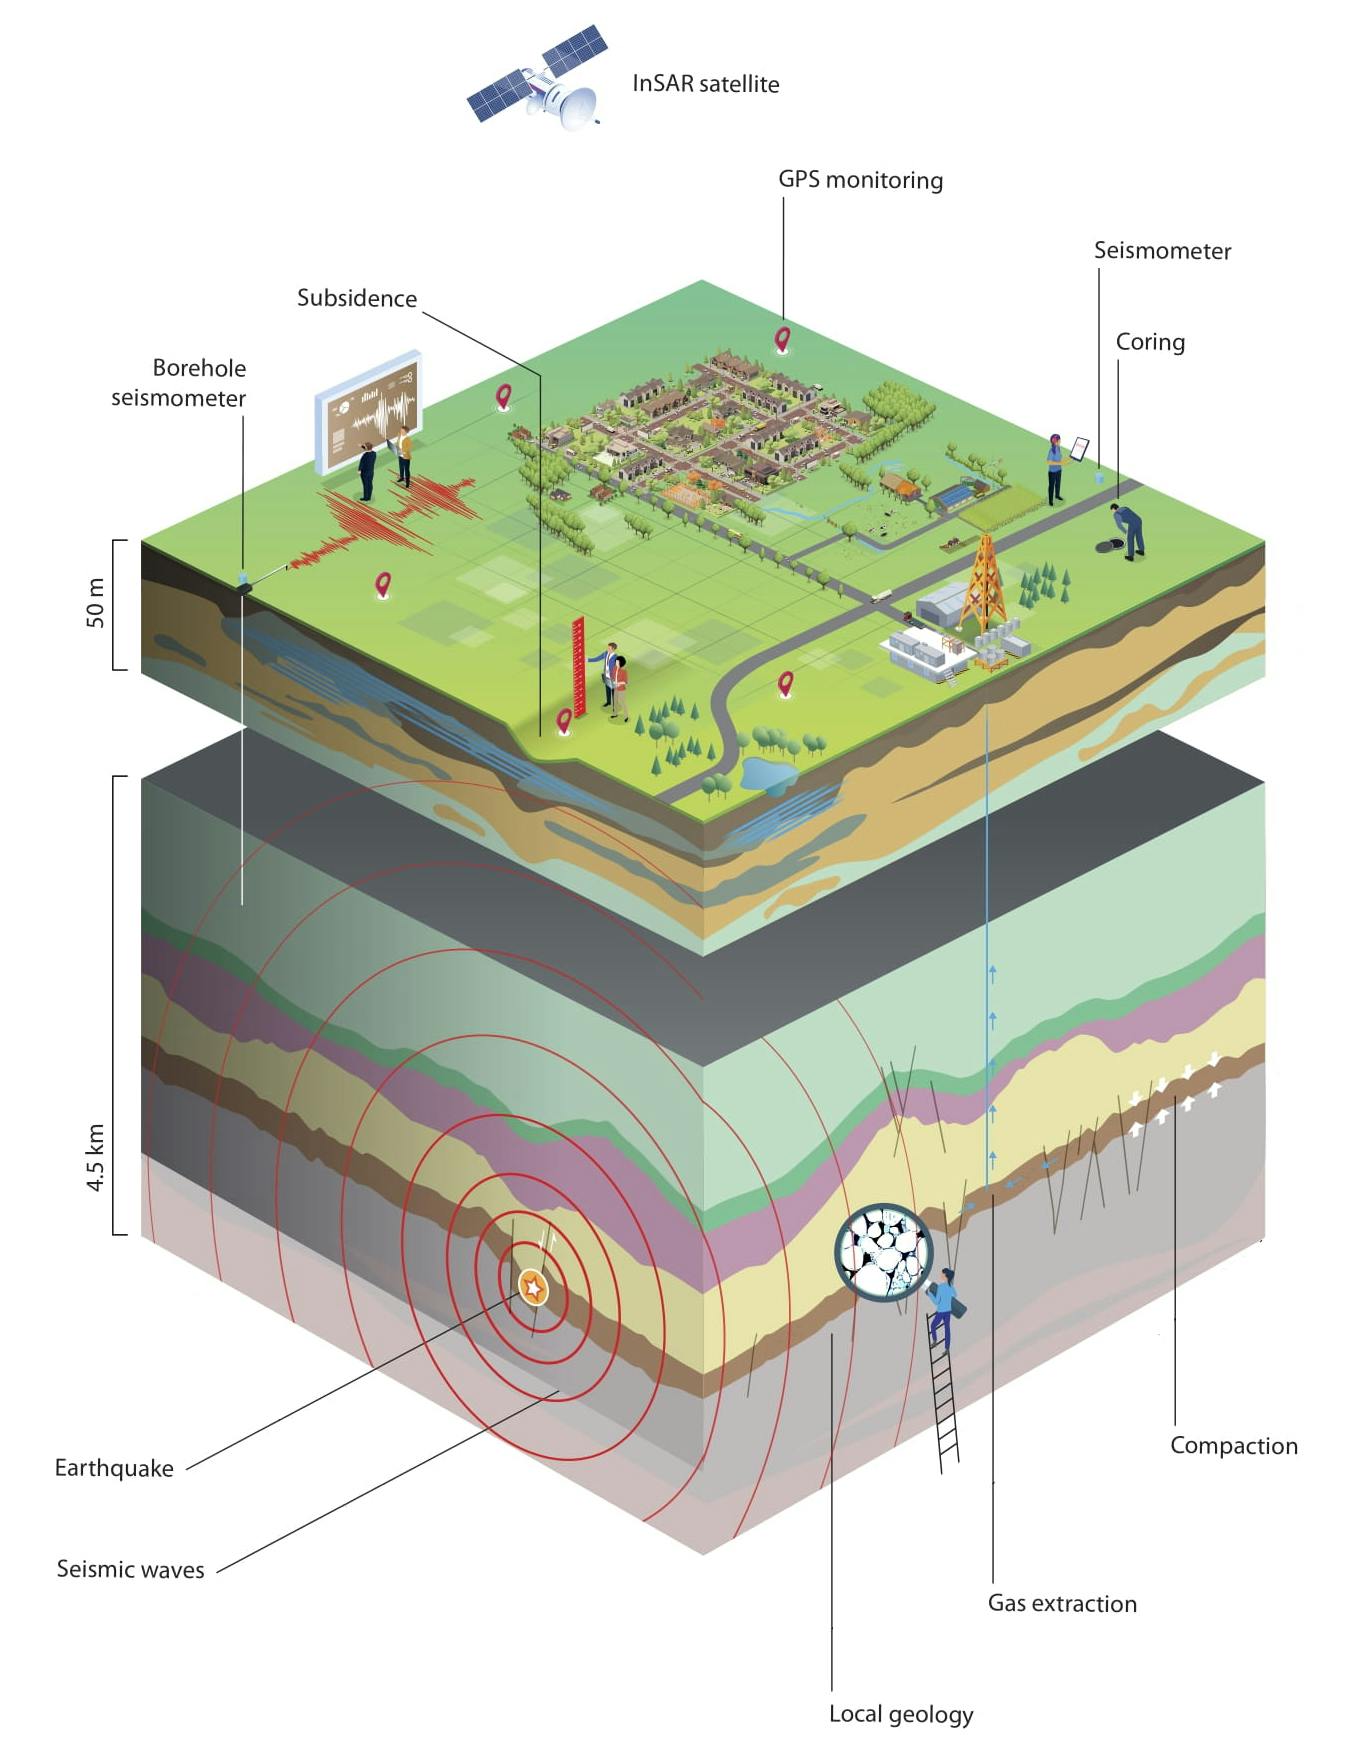
How does the deep subsurface behave under the influence of human interventions?
Monitoring the conditions of seismic events concludes analysis of processes in the deep subsurface that lead to seismicity and subsidence and can ultimately lead to earthquakes and subsidence.
The projects that represent subsidence and surface effects of seismicity are essential to understand and model how the processes at depth are translated through the subsurface to an effect at the Earth’s surface.
History
The World-Wide Network of Seismograph Stations was a global network of about 120 seismograph stations built in the 1960s integrated with the local networks for generating a collection of seismic data.
Before 1960, there were generally only individual seismic stations operating independently.
Each station made its observations, which were usually sent to some central location. If several stations were operating in a country or region, it was possible to talk about networks.[3]
However, the seismic network that operated until the mid-1990s was not very effective, in terms of seismic monitoring. On one hand, the low quality of the instrumentation, mostly related to low-dynamic acquisition systems, analog transmission, and paper recording, and the geographical sparseness of the stations, only allowed the location of 20%–25% of the local and regional detected events. In addition, only a few seismic stations recorded seismic data in real time. [1]
Geologist John Milne, a significant contributor to the understanding and evaluation of earthquakes, developed the first international network for seismological data, and created what may be considered the world’s first modern operating seismograph.
Milne horizontal pendulum
Working with Ewing and Gray in 1880, Milne invented a horizontal pendulum seismograph, a machine that records vibrations that occur with sudden movement along a fault line in the earth. These waves of motion can be one of two varieties: primary (“P waves”) or secondary (“S waves”), which move at different speeds. Primary waves move in a compression/expansion type of pattern and appear as wavy lines on a chart. Secondary lines, which are generally detected later than primary ones, are more snake-like, moving in a ragged sort of fashion. Examining both types of waves together allows determining the distance of a quake’s epicenter from the measuring station.
The worldwide nature of this network was critical for collecting data to provide global patterns for earthquake activity, which could then be evaluated at a central location remotely. [2]
Motivation
Some cases of seismic monitoring related to seismic risk caused by human activity are of special political concern. This includes monitoring for seismicity induced by large dams or around large mines. Monitoring of seismicity in a volcanic region is also dedicated to volcanic risk mitigation through the prediction of eruptions.
In locations prone to seismic events in South America or Asia with no seismic stations available, the Earthquake Early Warnings are highly needed to issue fast, accurate public alerts. [5]
Another important function of seismic networks is for explosion monitoring, particularly underground nuclear explosions. Seismic networks are essential to the monitoring of the international nuclear test ban treaty. [3]
The Comprehensive Nuclear-Test-Ban Treaty (CTBT)
As of June 2020, 184 states have signed the treaty and 168 have ratified it. Of the 44 nuclear capable States which must ratify the CTBT for it to enter into force, the so-called Annex 2 countries, 36 have done so while eight have yet to ratify: China, the Democratic People’s Republic of Korea, Egypt, India, Iran, Israel, Pakistan and the United States.
“The consequences of any use of nuclear weapon testing are catastrophic. There is not enough dissemination of this issue as it isn’t a political priority for governments.”
For forty years, between 1949 and 1989, the Soviet military tested more than 450 nuclear bombs – in the atmosphere and underground test site at the Semipalatinsk, the northeast part of former Soviet Kazakhstan, with devastating consequences. The military would insist that locals’ health problems stemmed from poor diet and living conditions . The data revealed in reports an in increase of cancer of esophagus, stomach, and liver, followed by a second peak of
lung, breast, and thyroid cancers. In one of the studies from 1,100 people 75 percent of those examined suffered from thyroid pathology, combining effects of ionizing radiation and iodine deficiency contributed to pathologies of the thyroid gland. [6]
Status of the Installation and Certification Programme for International Monitoring System Stations
Map of international monitoring stations, Primary, Auxiliary Seismic, Infrasound and Hydroacoustic, Radionuclide, and locations of nuclear explosions: https://www.ctbto.org/map/#ims
The International Monitoring System (IMS) is a global network of facilities for detecting and providing evidence of possible nuclear explosions. When completed, the IMS will consist of 321 monitoring stations and 16 radionuclide laboratories at locations around the world designated by the Treaty.[7]
Seismic networks
Due to the improvements in global communication which allows for easy access to data from
around the world, the concept of virtual networks has emerged. Access to data from a station by another operator could be directly from the station, but often the data is received from the central system.
Seismic networks are now mostly of this type of stations where the distinction between local, regional, and global networks does not exist any more in terms of hardware, data transmission, storage, and acquisition, but is merely a question of how the data is processed.
Today most data recorders and data transmission links are capable of accepting at least three channels of seismic data. The cost of upgrading the central processing facilities to accommodate an increased number of channels is relatively small and ground-motion vectors may be generated easily through data processing.
Examples of virtual networks are the Virtual European Broadband Seismic Network (VEBSN; see http://www.orfeus-eu.org/Data-info/vebsn.html), the GEOFON Extended Virtual Network (GEVN-GEOFON; see http://www.gfz-potsdam.de/geofon/ ) the Global Seismographic Network stations and arrays (code _GSN), the Federation of Digital Broad-Band Seismograph Networks stations (_FDSN). The “_” in front of the network code stands for virtual but many national networks become virtual by including data from stations by another operator within or outside the country. Examples of “real” networks are the Global Seismograph Network (GSN – IRIS/IDA) (code II) and the GEOSCOPE network code (G). [3]
Location
The main purpose of seismic networks is to determine earthquake locations and magnitudes, to issue alarms, general or specific seismic monitoring and to provide data for research on the interior of the Earth. If the hypocentral distance can be determined for each station independently from the difference of onset times of different seismic phases, e.g., S-P, then 3 stations are generally sufficient:

Fig. 8.1 Location by the circle (or arc) method. To the left is shown the seismograms at stations S1, S2 and S3 (right) with different amplitude scales recording a local earthquake. The time separation between the P and S-wave arrivals multiplied by the ratio vP·vS/(vP – vS) of the P- and S-wave velocities gives us the hypocentral distance (distance from the station to the earthquake’s focus at depth h).
S (shear) waves are secondary or shear waves in the ground that move perpendicular to the direction of the waves’ propagation. S-waves can only move through solids as this kind of movement is impossible in liquid or gaseous materials and travels a fraction slower than P compressional waves. [9]

A typical seismogram for a strong earthquake, recorded at a teleseismic distance: The P-waves arrive first, followed by the S-waves and the surface waves, which have the most destructive energy. The arrivals of the individual wave types can clearly be distinguished. [8]

The epicenter, which is the projection of the focus to the surface, is found within the black area where the circles cross with some “overshoot”. The circles will rarely cross at one point, which indicates errors in the observations, errors in the model, and/or a subsurface source depth. With only two stations there are either two possible locations, or no possible location if the two circles do not intersect. With more than three stations, the uncertainty in location decreases.
Minimization of large circle overshoot can be used to estimate the source depth (see Demo to EX11.1). Note that the “rule-of-thumb” formula given for the distance calculation in the lower right of the figure is for Sn-Pn only. It would be 8*(Stime – P-time) for Sg – Pg. [3]
Sensors
In high seismic risk areas where the main goal of networks is future seismic risk mitigation, strong-motion recordings play an important role, and two sets of sensors has to be installed so that the system never clips. Seismometers are very sensitive to small and distant events and are thus too sensitive for strong-motion signals. Accelerometers have been considered for strong motion only and seismometers for weak motion. The maximum scale acceleration of strong-motion accelerometers is usually expressed as a fraction of the Earth’s gravity, 1g (9.81 m/s2).
Although there are significant differences in strong and weak-motion network designs, today both types of sensors are frequently integrated into a single system. [3]
Frequency range
Today’s weak-motion sensors are roughly divided into three categories:
The short-period (SP) seismometers
The short-period (SP) seismometers measure signals from approximately 0.1 to 100 Hz, with a corner frequency at 1 Hz. They have a flat response to ground velocity for frequencies greater than this corner frequency. Typical examples are the Kinemetrics SS-1, the Geotech S13, and the Mark Products L-4C. The 4.5-Hz exploration-type geophone also belongs in this group. This sensor provides reasonably good signals down to about 0.3 Hz at a fraction of the cost of the 1.0-Hz sensor.
Broadband seismometers (BB)
Broadband seismometers (BB) have a flat response to ground velocity from approximately 0.01 to 50 Hz. Typical examples are the Guralp CMG3T seismometer with frequency range from 0.008 to 50 Hz, the Wieland-Streckeisen seismometer STS2 with a frequency range from 0.008 to 40 Hz and the similar Chinese CTS-1
The very broadband seismometers (VBB)
The very broadband seismometers (VBB) can resolve amplitudes of frequencies from below 0.001 Hz to approximately 10 Hz. The best performance at low frequencies is given by the Wieland-Streckeisen STS1 seismometer with frequency range from 0.0028 to 10 Hz (no longer produced). The Chinese JCZ-1 operates in an even wider range from 0.0028 to 50 Hz.
Application description and approximate frequency range of interest
Application | Frequency range (in Hz) |
Seismic events associated with mining processes | 5 – 2000 |
Very local and small earthquakes, dam induced seismicity | 1 – 100 |
Local seismology | 0.2 – 80 |
Strong-motion applications | 0.0 – 100 |
General regional seismology | 0.05 – 20 |
Frequency dependence of seismic-wave absorption | 0.02 – 30 |
Energy calculations of distant earthquakes | 0.01 – 10 |
Scattering and diffraction of seismic-waves on core boundary | 0.02 – 2 |
Studies of dynamic processes in earthquake foci | 0.005 – 100 |
Studies of crustal properties | 0.02 – 1 |
Dispersion of surface waves | 0.003 – 0.2 |
Free oscillations of the Earth, silent earthquakes | 0.0005 – 0.01 |
Frequency limits
The frequency limits shown above are the corner frequencies of the seismometer response functions. This means that analysis below the low-frequency corner and above the high frequency corner is usually still possible, however, with reduced gain. How much we can extend this range depends on the sensor design, the instrumental self-noise, the signal-to-noise ratio and beyond the upper corner frequency also on the sampling rate.
Smartphone-based Networks for Earthquake Detection
Modern smartphones are equipped with built in accelerometers 2g with the hardware supported sampling frequency less than 100hZ. Due to the unpredictable nature of earthquakes, the Richmond Field Station’s Shake Table is suitable for generating high fidelity motion for testing purposes. From the test results of “Smartphone-based Networks for Earthquake Detection” smartphones are capable of sensing earth-quake motion at a distance of 10km above a certain magnitude. [5]
Short-period seismometers such as geophones can obtain signals from slow earthquakes that are observed in the > 1 Hz frequency band (tectonic tremor) or low-frequency earthquakes (LFEs) and very-low-frequency earthquakes (VLFEs) in the 0.01–0.10 Hz band. These two phenomena are separated by large microseismic noise at 0.1–1.0 Hz. The SP sensors were historically developed as ‘mechanical filters’ for mitigating distracting natural seismic noise in the range 0.12 – 0.3 Hz. [11]
Subsurface activities related to energy transition
The research programme DeepNL in the Netherlands is a national research community that provides prior advice on hazard and risk assessment models for subsurface activities and to adapt these to new applications.
KEM-DeepNL colloquium is the first joint colloquium organized by the Knowledge Programme on Effects of Mining (KEM) and DeepNL in the Netherlands.
One of their goals is to produce results that are of relevance for future energy transition related subsurface activities such as geothermal energy production, temporal and cyclic storage of H2, and for CO2 sequestration.
Geothermal resources have the potential to provide up to 150GWe of sustainable energy by 2050
However, the authors underline that the key challenge in successfully locating and drilling geothermal wells is to understand how heterogeneous structure of the subsurface controls the existence of exploitable fluid reservoirs suitable for profitable utilization of intermediate to high-temperature geothermal resources for power generation.
When geothermal energy becomes more competitive with fossil fuels, especially if carbon penalties are applied to the price, and environmental benefits are better understood and accepted, development of the ‘heat from earth’ should begin to accelerate. A score based on global electricity generation in 2021 has hydro at the head of the top five renewable energies supplying 15.3% if global electricity at cost of $64 per MWh, wind is the second with 6.6% ($38 per MWh), solar is third with 3.7% ($36). Biomass takes fourth place with 2.3% ($114) and geothermal lags with less than 1% ($75 per MWh).
The main driver of geothermal activity is elevated crustal heat flow, which is focused in regions of active magnetism and/or crustal thinning. Permeable structures, such as faults, exercise a primary control on local fluid control patterns, with most upflow zones residing in complex fault interaction zones. Major risks in geothermal resource assessment and operation include locating sufficient permeability for fluid extraction, in addition to declining reservoir pressure and the potential of inducted seismicity. Future innovations involve engineered geothermal systems as well as supercritical and offshore geothermal resources, which could expand the global application of geothermal energy but require detailed knowledge of the respective geological conditions. [13]
Seismological data centers
IRIS, Incorporated Research Institutions for Seismology
IRIS is the largest global data centre and receives 1,000s of seismic channels in near real-time. The Global Seismograph Network (GSN) itself consists of more than 150stations. The remaining data is provided by other networks from around the globe. Subsets of data are combined into virtual networks, such as the GSN and FDSN networks. GSN was re-equipped by 2013 with standardized data collection systems based on the Quanterra Q330HR (high resolution) systems. http://www.iris.edu/data/request.htm
GFZ Seismological Data Archive
Geofon network. The most used software in Europe is the public domain SeisComp – SeedLink system developed by GFZ (German Research Centre on Geosciences in Potsdam) (see http://geofon.gfz-potsdam.de/geofon//seiscomp/ and ttp://www.seiscomp3.org) and the largest network using this software is the global GEOFON network consisting of GFZ stations and cooperating stations in other countries The GEOFON archive includes over 180 seismic networks with more than 6700 stations, spanning 29 years from 1993 to today. https://geofon.gfz-potsdam.de/waveform/archive/
Japanese seismic networks (Hi-net, F-net, and K-NET/KiK-net)
Four seismic networks are presently operated by the National Research Institute for Earth Science and Disaster Prevention (NIED) in Japan (http://www.bosai.go.jp/e/ )The Hi-net data are sent to the Japan Meteorological Agency (JMA) and used by the “Earthquake Early Warning” system, operated by JMA. Seismic intensities recorded by the K-NET, which is part of the nationwide seismic intensity network, are widely broadcast by television and radio stations.
-
J-SHIS (Japan Seismic Hazard Information Station; http://www.j-shis.bosai.go.jp/?lang=en );
-
NIED (http://www.bosai.go.jp/e/ );
-
Hi-net (High sensitivity seismograph network (http://www.hinet.bosai.go.jp /);
-
F-net (Full range broadband seismograph network (http://www.fnet.bosai.go.jp/top.php?LANG=en );
-
K-NET (Kyoshin strong-motion network (http://www.k-net.bosai.go.jp/);
-
KiK-net (Kiban Kyoshin strong-motion network of vertical arrays (http://www.kik.bosai.go.jp/ ).
Seismic networks in China (by Liu Ruifeng and P. Bormann)
The data are available for general use via http://data.earthquake.cn and further information is provided on http://www.ceic.ac.cn
German Regional Seismic Network (GRSN) (by K. Stammler)
The station sites of the Gräfenberg Array (GRF), the German Regional Seismic Network (GRSN) http://www.seismologie.bgr.de and http://www.szgrf.brg.de , provides information on available earthquake lists, bulletins, waveform data, station information, long-period and short-period dayplots of station recordings.
Swiss Seismological Service (SED)
http://www.seismo.ethz.ch/en/home/ The Swiss Seismological Service (SED) at ETH Zurich is the federal agency for earthquakes. Its activities are integrated in the federal action plan for earthquake mitigation.
International Seismological Centre (ISC)
(http://www.isc.ac.uk/ ) for final bulletin creation about two years behind real time. The International Seismological Centre is a non-governmental organization charged with the final collection, analysis and publication of standard earthquake information, readings are received from almost 3,000 seismograph stations. [3]
References:
Events:
5-8 June 2023, Vienna, Austria, European Association of Geoscientists & Engineers (EAGE) Annual Conference and Exhibition. Deadline for abstract submission is 15 January 2023.https://eageannual.org/technical-programme/
17-21 September, 2023, Rome, Italy, 12th International Conference on Geosynthetics, submission deadline for academic papers: 31 October 2022 https://www.12icg-roma.org/submission/theme-topics/
Publications:
-
John Milne, Seismograph, COMPUTING AND TELECOMMUNICATIONS.https://lemelson.mit.edu/resources/john-milne
-
The Portuguese National Seismic Network —Products and Services. Fernando Carrilho, Susana Custodio, Mourad Bezzeghoud, Carlos Sousa Oliveira. February 2021 https://www.researchgate.net/publication/349413626_The_Portuguese_National_Seismic_Network_-Products_and_Services
-
Chapter 8 Seismic Networks (Version August 2011; DOI: 10.2312/GFZ.NMSOP-2_ch8) Jens Havskov1), Lars Ottemöller1), Amadej Trnkoczy2), and Peter Bormann3) https://gfzpublic.gfz-potsdam.de/rest/items/item_43210/component/file_352736/content
-
CTBTO spectrum magazine, issue 25, July 2020 https://www.ctbto.org/fileadmin/user_upload/pdf/Spectrum/2020/00_025_Spectrum_July_2020_web.pdf,
-
Smartphone-based Networks for Earthquake Detection, Qingkai Kong, July 2015DOI:10.1109/I4CS.2015.7294490 https://www.researchgate.net/publication/295551674_Smartphone-based_Networks_for_Earthquake_Detection
-
CTBTO spectrum magazine, issue 25, July 2020 https://www.ctbto.org/fileadmin/user_upload/pdf/Spectrum/2020/00_025_Spectrum_July_2020_web.pdf,
-
CTBTO Annual report, 2020 https://www.ctbto.org/fileadmin/user_upload/pdf/Annual_Report_2020/English/00-CTBTO_AR_2020_EN_cover.pdf
-
Detection of Hazardous Ground Movements with Instantaneous Velocity Estimates by GNSS, Roland Hohensinn https://www.researchgate.net/figure/A-typical-seismogram-for-a-strong-earthquake-recorded-at-a-teleseismic-distance-The_fig8_335492034
-
CTBTO Glossary https://www.ctbto.org/index.php?id=280&no_cache=1&letter=s#seismometer
-
CTBTO Seismic monitoring https://www.ctbto.org/verification-regime/monitoring-technologies-how-they-work/seismic-monitoring/
-
Bridging the gap between low-frequency and very-low-frequency earthquakes, article by Koki Masuda, Satoshi Ide, Kazuaki Ohta & Takanori Matsuzawa, 2020 https://earth-planets-space.springeropen.com/articles/10.1186/s40623-020-01172-8
-
DeepNL Annual report, 2021 https://www.nwo.nl/sites/nwo/files/media-files/DeepNL%20Annual%20Report%202021.pdf
-
Jolie et al in their review ‘Geological controls of geothermal resources for power generation’ in Nature Reviews Earth & Environment Vol 2, 324-339 (2021)
-
First Break September 2022 – Reservoir Engineering & Geoscience, EAGE, https://issuu.com/eage/docswithlinks_hr_22893-fb22_september